Accelerators
›Purpose-built LLM systems, multi-agent reasoning workflows, and domain-adapted models.
Universal semantic metric layers, natural language querying, and executive intelligence.
Mathematical constraint solvers (MILP, CP-SAT) for scheduling, allocation, and routing.
Pragmatic ERP modernisation, event-driven API mesh, and custom operational applications.
Industry Trends in AI & Analytics
Practical benchmarks on what actually works when moving AI from pilot to production.


You cut carrying cost by planning stock per SKU and per location, sizing safety stock to real variability, and fixing reorder rules. You do not cut it by trimming stock across the board. Flat cuts remove the buffer from fast movers and leave slow movers in place, so stockouts rise while the cash stays tied up.
This guide is for CFOs and COOs at manufacturers and distributors in the Rs 1,000 to 2,000 crore range, in India and the US. It covers what carrying cost includes, how to calculate it, why excess and stockouts happen together, and three fixes that work on the ERP you already run.
What does inventory carrying cost include?
Carrying cost is everything you spend to hold stock until it sells. It has four parts: capital, service costs such as insurance and tax, risk costs such as obsolescence and shrinkage, and storage and handling. The Institute for Supply Management describes the same four components (ISM).

Capital. The cash tied up in stock, and what it costs you to fund it. Some teams also add opportunity cost: the return that cash could earn elsewhere.
Service costs. Insurance on the stock, taxes on it, and the systems used to manage it.
Risk costs. Damage, theft, deterioration and obsolescence. ASCM's SCOR model defines shrinkage as "the costs associated with breakage, pilferage, and deterioration of inventories" (ASCM SCOR). For perishables, this line is often the one that hurts most.
Storage and handling. Warehouse space, labour and equipment, whether you own the site or pay a third party.
APQC's benchmark measure uses a similar list: cost of capital, storage space, insurance, taxes, handling and administration, shrinkage and obsolescence (APQC). The point for a CFO is simple. If your number leaves out obsolescence or handling, it is too low.
How do you calculate carrying cost?
Add up a year of holding costs and divide by average inventory value. The result is your carrying cost rate, as a percentage of inventory value. APQC defines its measure the same way: inventory carrying cost as a percentage of average inventory value (APQC).
Carrying cost rate = total annual holding costs / average inventory value x 100
A worked example. These numbers are illustrative only. They are not a benchmark or a client figure.
Component (illustrative) | Annual cost |
|---|---|
Capital (cost of funds on stock) | Rs 18 crore |
Storage and handling | Rs 7 crore |
Insurance and tax | Rs 2 crore |
Obsolescence and shrinkage | Rs 5 crore |
Total holding cost | Rs 32 crore |
Average inventory value | Rs 200 crore |
Carrying cost rate | 16% |
In this example, every Rs 10 crore of stock you do not need costs about Rs 1.6 crore a year to hold. That is the number to put next to any stock decision.
Two tips. Use average inventory across the year, not the year-end figure, because year-end stock is often managed down. And include work in progress if you hold a lot of it.
Why do companies have excess inventory and stockouts at the same time?
Because stock is planned in total, but sold by SKU and by location. A company can hold too much in aggregate and still run out of the items customers want, in the places they want them. Three causes come up again and again.
Location | Fast mover | Slow mover |
|---|---|---|
Warehouse A | Out of stock | Excess |
Warehouse B | Excess | Out of stock |
Warehouse C | Out of stock | Excess |
The wrong mix by location. Warehouse A has three months of a slow mover. Warehouse B is out of a fast mover. The total looks fine. The customer in B does not care about A.
Flat safety stock. A common setup is a fixed buffer, such as two weeks of cover for every item. That is too much for steady items and too little for volatile ones.
Aggregate forecasts. A forecast by product family or by region can be accurate and still useless at SKU level. The errors cancel out in the total and show up on the shelf. We wrote about this in the forecast was accurate, the inventory decision was still wrong.
Fix 1: Forecast by SKU and location
Forecast at the level where you hold stock: each SKU at each warehouse or branch. A forecast at that level shows where stock is short and where it is idle. Family-level forecasts cannot.
Practical steps:
Start from shipments or sales orders by SKU, location and week.
Separate steady items from lumpy ones. Lumpy items need a different method, or a plan by hand.
Add known drivers, such as promotions, festivals, seasons and new listings.
Track forecast error per SKU and location, not only in total.
This is the work our ForecastNow accelerator and the Demand and Supply Intelligence accelerator are built for. For the modelling side, see predictive analytics using machine learning.
Fix 2: Dynamic safety stock
Size safety stock to each item's real variability, then recalculate it as conditions change. Buffers should grow where demand or supplier lead time is volatile and shrink where it is steady. The service level you want should drive the buffer, not a flat rule.
What changes in practice:
Inputs per SKU and location. Demand variability, lead time and lead time variability, and a target service level.
Different targets for different items. A-class items that drive revenue may justify a higher service level. Long-tail items may not.
Regular recalculation. Lead times and demand shift. A buffer set last year is probably wrong today.
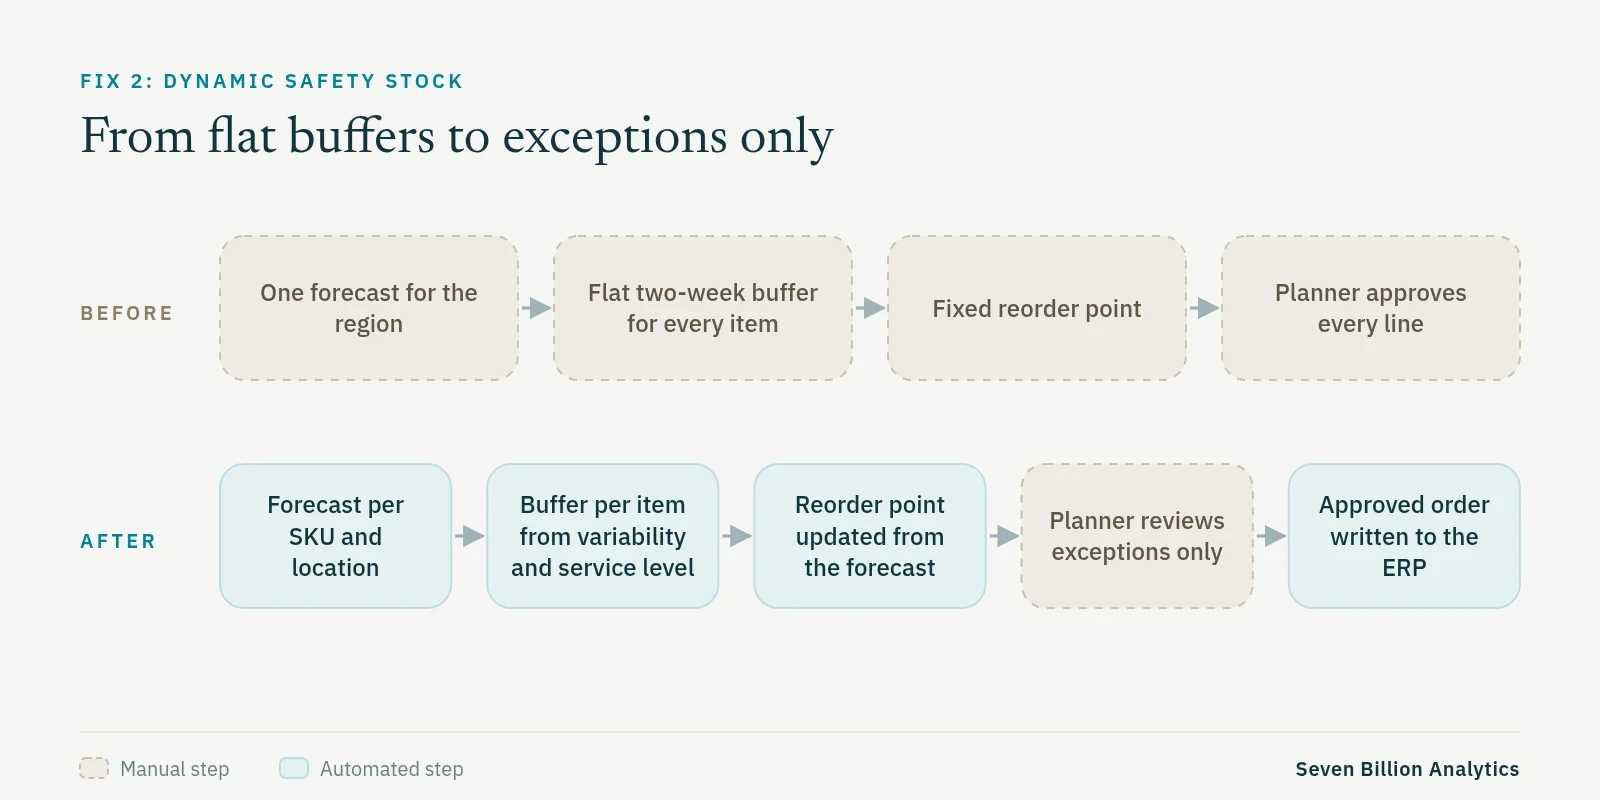
Dynamic safety stock usually moves stock rather than simply cutting it. Some items get more, many get less. The net effect is what you track.
Fix 3: Reorder rules and lot sizes that match the forecast
Set reorder points and order quantities from the forecast and the new safety stock, not from habit. In our experience, many reorder rules were set years ago and never revisited. Fixing them turns a better forecast into a better order.
Where to look:
Reorder points. Expected demand over the lead time, plus safety stock. If the forecast changes, the reorder point should too.
Lot sizes and minimum order quantities. Large lots cut ordering cost but raise stock. Check whether supplier minimums can be renegotiated for slow items.
Transfers between locations. Before buying more, check if another warehouse holds the item idle. This is the core of multi-warehouse inventory optimisation.
Exceptions, not every line. Planners should review the orders that break a rule, not approve thousands of routine lines.
Our supply chain optimisation work covers forecasting, buffers and reorder rules as one flow.
Where AI helps and where it does not
AI helps most with forecasting at SKU and location level, spotting changes in demand early, and ranking which exceptions a planner should look at first. It does not fix bad master data, missing lead times or stock that is not posted on time. It also should not place orders with no human check at the start.
Where it helps:
Forecasting thousands of SKU and location pairs that no team could do by hand.
Picking up drivers like promotions, seasons and festivals.
Flagging low stock early and drafting a reorder for a planner to approve.
Where it does not:
Wrong units of measure, duplicate items or stale lead times. Fix those first.
Strategic calls, such as exiting a product line or changing a supplier.
Stock records that arrive a day late. The model can only be as current as the data.
One example from our work. A food-service distributor in India was losing margin to perishable shrink and next-day reports that forced emergency buys. We built live stock dashboards with a freshness view for every item, and when the forecast flags low stock, a reorder is raised in their Microsoft Dynamics NAV. The result: 18% less perishable wastage, a 96% fill rate and ₹1.2 crore added margin. These are results from one anonymised client engagement. More on our ERP implementation and modernisation page.

Where to start
Start small: one product category, one region, 60 to 90 days. Measure carrying cost, fill rate and stockouts for that slice before and after. If it works, roll it out category by category.
A simple plan:
Pick the slice. A category with high stock value and frequent stockouts, in one region.
Baseline it. Current carrying cost, fill rate, stockout count and days of cover.
Clean the inputs. Item masters, lead times and units for that slice only.
Run the new rules beside the old ones. Compare recommendations before you switch.
Switch and measure. Review results with finance at the end of the window.
If you run plants, our manufacturing page shows how this links to production planning.
Talk to us
If your stock is high and your fill rate still slips, start with Phase 0. Phase 0 is a two-week discovery that tells you exactly which problems AI can solve, what it will take to build, and what it will cost. No obligation beyond it. Book a discovery call.
FAQ
What is a typical inventory carrying cost?
There is no single right number. It depends on what you include, your cost of capital and how perishable your stock is. ISM says there are "no consensus ICC benchmarks", but that most companies "strive for" between 20 and 30 percent of total inventory costs. That is a target, not a measured average (ISM). For a measured figure, APQC's open benchmark shows a median of 10.0% of average inventory value across its sample (APQC). Track your own rate year on year.
How is carrying cost calculated?
Add a year of holding costs: capital, storage and handling, insurance and tax, and obsolescence and shrinkage. Divide by average inventory value for the same year and multiply by 100. Use the average across the year, not the closing balance.
Does reducing inventory increase stockouts?
It does if you cut across the board. It need not if you plan by SKU and location. Dynamic safety stock moves buffer to volatile, high-value items and takes it from steady or slow ones. Track fill rate next to stock value, so a cut that hurts service shows up at once.
How often should safety stock be recalculated?
Recalculate whenever demand patterns or lead times shift, and on a fixed cycle in between. A monthly cycle is a sensible default, with more frequent checks for volatile or seasonal items. The right cycle depends on how fast your demand and supply change, so test it on your first category.
Can we do this on our existing ERP (SAP, Infor LN, Dynamics)?
Usually, yes. The forecast and buffer logic can sit beside the ERP, read stock and orders from it, and write approved reorders back through its own interfaces. The ERP stays the system of record. Our live example runs on Microsoft Dynamics NAV.
KEEP READING
Explore more perspectives on AI, analytics, and enterprise intelligence.